Job Status Dashboard: % Complete, Duration & the Big Screen TV
Walk onto a shop floor and ask "how's job 4835 coming along?" and you'll get a different answer from every person you ask. A Job Status Dashboard exists so nobody has to ask — five numbers, one glance, and the whole room knows exactly where every job stands.
11 August 2026
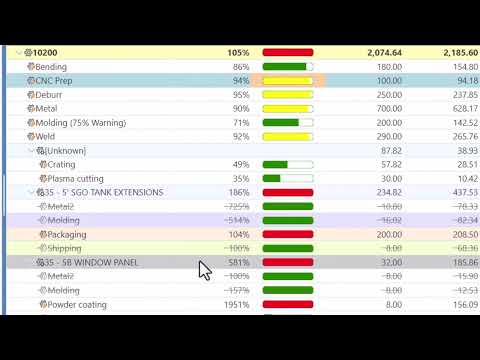

Green means on pace, yellow means watch it, red means it needs attention right now — no login required to read it.
What a Job Status Dashboard Actually Shows
A Job Status Dashboard is nothing more than a Project Tasks grid, arranged so the handful of numbers that matter most are the only ones anyone has to look at: which job, how far along it is, and whether it's keeping pace. Everything else — the underlying schedule math, the cost rollups, the dependency chains — is still there if you need to dig in, but the dashboard view hides it so a supervisor walking by can absorb the whole shop floor in about two seconds.
Five fields do almost all of the work: Percent Complete, the % Status Bar that visualizes it, Duration, Actual Work, and Remaining. Understand how those five relate to each other and the dashboard stops being a wall of numbers and starts being a story about every job in the building.

The bar's length is the raw percentage. Its color is something smarter — pace against schedule.
Percent Complete: The One Number Everyone Understands
Percent Complete is the number that needs no explanation — 0% means nobody has touched it yet, 100% means it's done, and everything in between is exactly what it says. It's the single most useful field on a task for the simple reason that a plant manager, a new hire, and the owner all read it the same way without training.
Standard Time® tracks Percent Complete on every task, and it can move in whichever way fits how a shop actually works: updated automatically as time gets logged against the task, driven off quantity built versus quantity ordered for production runs, or set by hand when a supervisor knows better than the math does. Whichever source feeds it, it's the field that drives everything else on the dashboard.
The % Status Bar: Color at a Glance
A bare percentage is honest but slow to scan — reading "62%" still takes a second of thought. The % Status Bar turns that number into a shape and a color instead: a horizontal bar fills left to right with the percentage, so length alone tells you roughly how far along a job is without reading a single digit.
The color is where it gets genuinely useful. Standard Time® doesn't just color the bar green below some fixed percentage — it compares each task's actual progress against where it should be by now given its schedule. A job at 40% complete that's only a third of the way through its allotted time is doing fine and shows green. That same 40% on a job that's already burned through most of its schedule is a problem, and the bar turns yellow, then red, as it falls further behind. Two configurable thresholds control exactly how much slack a task gets before the color changes — set them tight for time-sensitive work, looser for jobs with more natural buffer.
That's what makes the dashboard scannable from across a room: you're not reading percentages, you're reading colors, and a sea of green with one red bar tells you exactly where to look first.

Three numbers, one relationship — and Standard Time® keeps them in sync automatically as time gets logged.
Duration, Actual Work, and Remaining: The Numbers Behind the Bar
Percent Complete tells you the story in one number; Duration, Actual Work, and Remaining tell you the same story in hours, which is what actually matters when you're deciding whether a job will ship on time.
- Duration — the total time a task is expected to take from start to finish, the full scope of the work.
- Actual Work — the time genuinely logged against the task so far, pulled straight from time log entries as employees clock in and out or scan barcodes on the shop floor.
- Remaining — what's left to do. It isn't a separate estimate someone has to update by hand; it's calculated as Duration minus Actual Work, so it shrinks on its own every time more time gets logged.
That relationship — Duration = Actual Work + Remaining — is what keeps the dashboard honest without anyone maintaining it. Log four more hours against a task and Actual Work goes up, Remaining goes down, and Percent Complete recalculates right along with it, all from the same time log entries that already drive payroll and job costing. If the scope of the job genuinely changes — more parts added to the run, a design revision — Duration itself can be revised, and Remaining recalculates from that new baseline.

The same live view every supervisor already has at their desk — just bigger, and visible to everyone at once.
Show Job Status on a Big Screen TV
Everything above works just as well on a desktop monitor as it does across a shop floor — but the real payoff is putting it somewhere everyone can see it without opening Standard Time® at all. Filter the Project Tasks grid down to active jobs, show the % Status Bar, Duration, and Remaining columns, hide everything that isn't part of the story, and turn on auto-refresh so it stays current all day without anyone touching it.
From there it's just a browser and a cable: open the filtered view full screen on a Chromebook or mini PC logged in under a shared display account, connect it to a TV over HDMI, and mount the TV somewhere visible — over the break room door, at the end of an aisle, wherever the crew already looks. No refreshing, no logging in, no interrupting a supervisor to ask how a job is going. The color of the bar answers the question before anyone has to ask it.
For the full step-by-step on the hardware side — Chromebook setup, font sizing for readability at a distance, full-screen mode — see 7 Steps to Set Up a Big-Screen TV for WIP. That guide covers the mechanics of the display; this one covers what the numbers on it actually mean.
Job Status & Dashboard Guides
- 7 Steps to Set Up a Big-Screen TV for WIP — the hardware and browser setup for a shop floor display
- Gantt Chart and Project Tasks — how the same Percent Complete and Duration fields drive the Gantt view
- Resource Allocation & Capacity Planning — the same green/yellow/red logic applied to staffing instead of task progress
- How to Run Time Reports — where Actual Work and Duration ultimately come from
- FAQ: Project Management & Gantt